The Sentinel rock avalanche of Zion National Park, Utah
Blocking the mouth of Zion Canyon over a distance of 2.3 km, the prehistoric Sentinel rock avalanche has had long-lasting impact on the spectacular scenery of Zion National Park, once damming a large lake that eventually filled the rocky canyon with sediment. Today Zions nearly 3 million annual visitors take advantage of the gentle and inviting, flat valley floor set amidst great sandstone cliffs that owes its origin to this massive landslide. We combine new mapping of rock avalanche and lacustrine deposits to reconstruct topography before and after the landslide, comment on failure kinematics, and determine refined volume estimates for the event. Cosmogenic nuclide surface exposure dating of deposited rock avalanche boulders allows us to date the slide, determine subsequent rates of erosion, and explore potential triggering mechanisms. Boulders from across the slide surface were deposited simultaneously, yielding similar exposure ages and indicating a single massive and catastrophic rock slope failure.
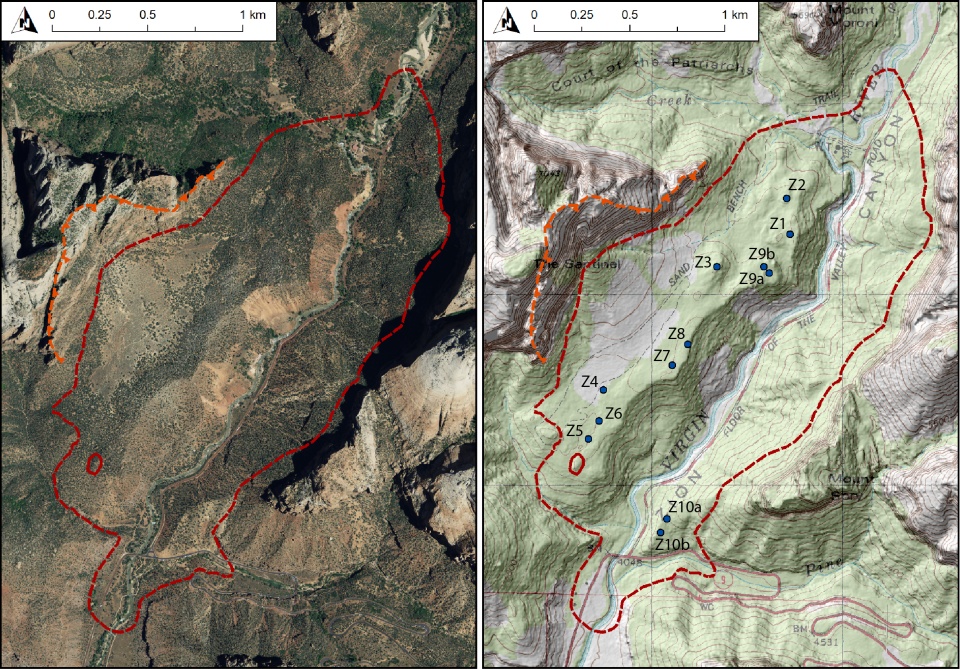
Figure: (left) Aerial image overview of the Sentinel rock avalanche deposit and source area at the mouth of Zion Canyon. (right) Topographic map of the same; points are samples for cosmogenic dating. Red dashed line is the mapped or presumed deposit boundary; orange line shows the slide scarp.
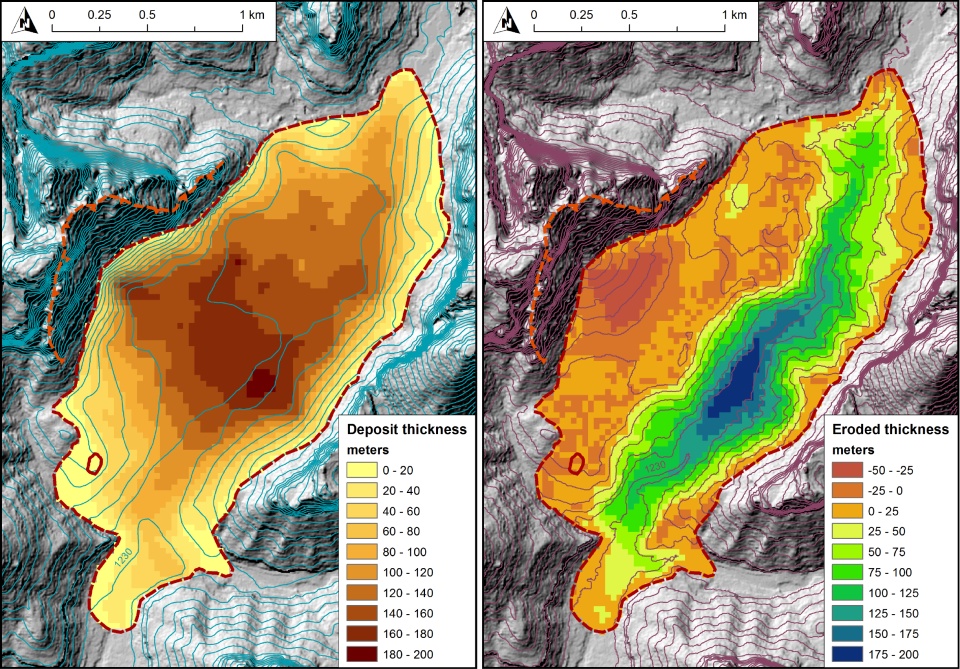
Figure: (left) Reconstructed original thickness of the Sentinel rock avalanche deposit, shown with estimated basal topography. (right) Difference between post-slide surface and modern topography revealing eroded areas of the deposit; new deposits are shown by negative numbers.
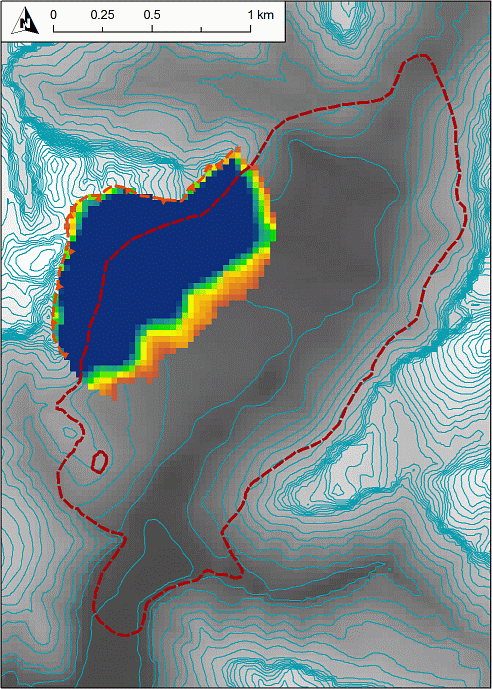
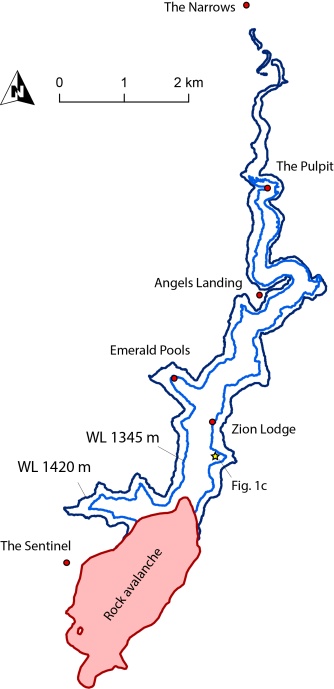
Figure: (left) Animation of the Sentinel rock avalanche dynamics; simulated duration is 90 s and the results have been sped up 20x for viewing purposes. (right) Sentinel Lake at its proposed high-stand, shortly after the rock avalanche, and its long-term stable stand at slightly lower elevation.
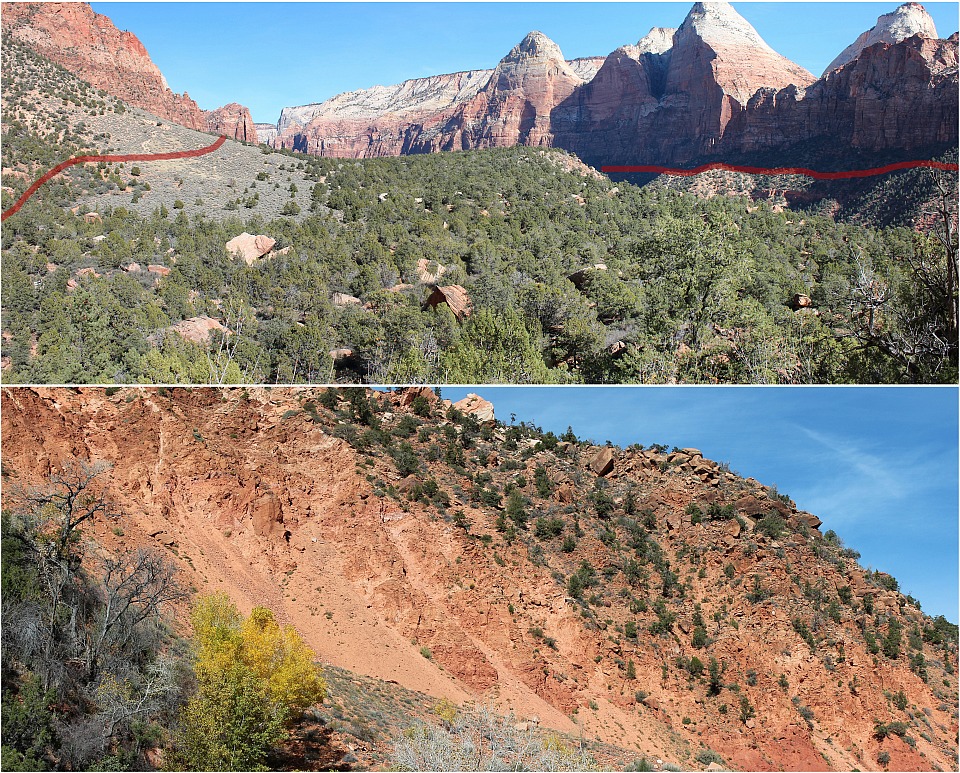
Figure: (top) Overview of the Sentinel rock avalanche deposit looking north. (bottom) Cross-sectional view of rock avalanche debris exposed in the Virgin River gorge near the mouth of Zion Canyon.