Data
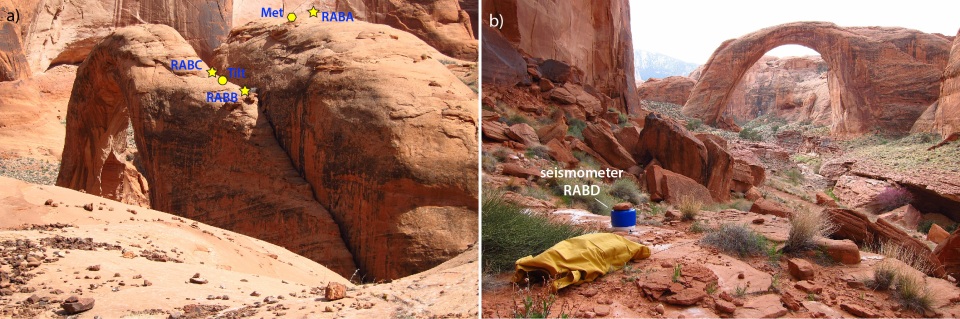
The following data were generated and analyzed by Moore et al. (2016): Anthropogenic Sources Stimulate Resonance of a Natural Rock Bridge, Geophysical Research Letters, doi: 10.1002/2016GL070088
| Start Date (UTC) | Start Time (UTC) | Duration (hh:mm) | Sampling Rate (Hz) | Location | File |
|---|---|---|---|---|---|
| 23/03/2015 | 21:00 | 22:00 | 100 | RABA | RABA.miniseed |
| 23/03/2015 | 23:00 | 20:00 | 100 | RABB | RABB.miniseed |
| 23/03/2015 | 23:00 | 20:00 | 100 | RABC | RABC.miniseed |
| 24/03/2015 | 01:00 | 16:00 | 100 | RABD | RABD.miniseed |
Don't know how to read miniseed files? Check here.